Файл:Kscaleprojections.png
Арыгінальны файл (1 115 × 647 кропак, аб’ём файла: 23 KB, тып MIME: image/png)
Тлумачэнне
| Апісанне |
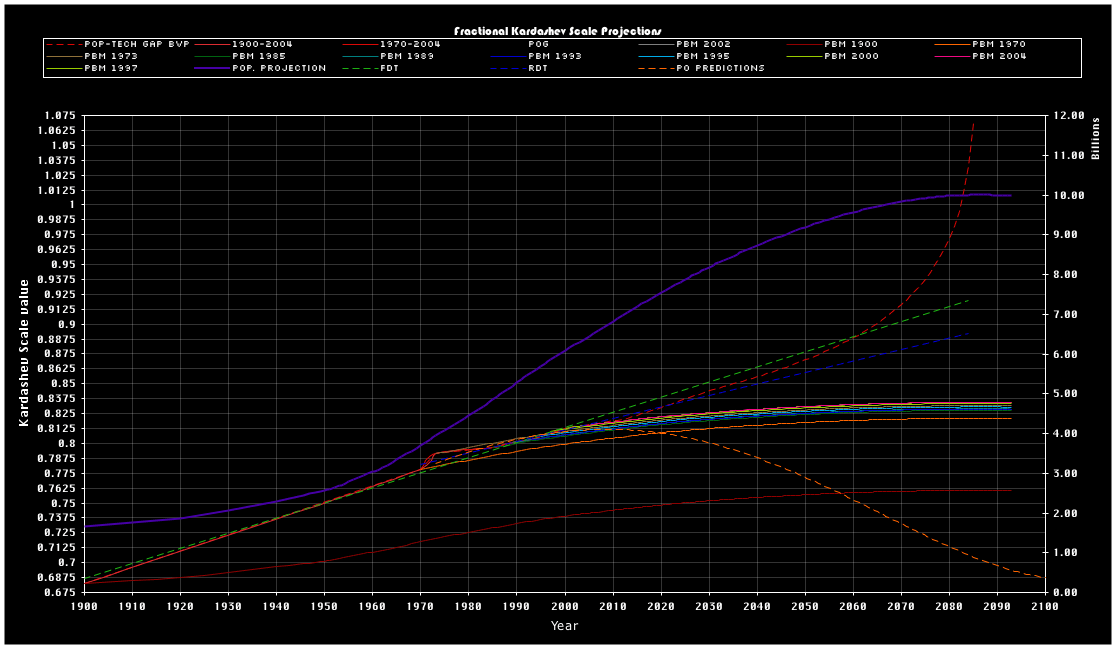
Русский: Шкала Кардашева
English: An image of Kardashev scale projections ranging from 1900 to 2100. The projections are off by 0.1 on the kardashev scale. This is graphed against the supportable population and given growth against the supposed technology growth associated the kardashev scale. Projections are made by different ratios of energy production to technology growth for a given level of energy (and technology) against predicted population growth, and new technology production and new energy production needed to support a given population, and the growth of such population. In some projections, if energy production is unable to keep up with population growth, technology levels fall. In some projections, as population growth slows, supposedly increased technology can be produced via the lower amount of energy needed to sustain population growth.
Outside comment : It appears much of the data were taken from International Energy Agency, World Energy Outlook 2005, pg. 82, according to User:Sparkygravity. The following is an incomplete legend of lines plotted, with completeness to follow once all original acronyms can be deciphered:
Note that there are no units given for any such plots, though the population projection probably aligns on the right and another user has suggested that the energy "PBM" scales are converted from IEA data on the left. This makes the combination of logarithmic and linear vertical scales, as well as population and energy scales, on the same axis questionable at best, but more likely useless and confusing, and therefore should likely be cleaned up if this image is to retain any usability. Many articles and reproductions online (notably Technological Singularity have vastly misinterpreted this graph in thinking that all lines are Kardashev-scale projections, which has been shown to not be the case. Only the dense cluster of lines are projections relevant to the left-hand Kardashev scale. It is therefore recommended that captions be changed and this image not be used further in any encyclopedia articles for ongoing ambiguity, original research, and confusion in plotting. |
| Дата | 7 ліпеня 2005 (original upload date) |
| Крыніца | Transferred from en.wikipedia to Commons. |
| Аўтар | Ctrl build at англійская Вікіпедыя |
Ліцэнзіяванне

|
Дазваляецца капіяваць, распаўсюджваць і(або) мадыфікаваць гэты дакумент на ўмовах ліцэнзіі GNU FDL версіі 1.2 або навейшай, выдадзенай Фондам свабоднага праграмнага забеспячэння; без Нязменных раздзелаў, без тэкстаў Вокладак. Копія ліцэнзіі ёсць у раздзеле GNU Free Documentation License. |
| Гэты файл даступны па ліцэнзіі Creative Commons Пазначэнне аўтарства - На тых самых умовах 3.0 Непартаваная | ||
| Пазначэнне аўтарства: Ctrl build at англійская Вікіпедыя | ||
| ||
| Гэтая картка дададзеная ў якасці часткі абнаўлення ліцэнзіі GFDL. |
- Вы можаце свабодна:
- дзяліцца творам – капіраваць, распаўсюджваць і перадаваць гэты твор.
- ствараць вытворныя творы – адаптаваць гэты твор
- Пры выкананні наступных умоў:
- атрыбуцыя – вы павінны пазначыць аўтарства гэтага твора, даць спасылку на ліцэнзію і пазначыць ці рабіў аўтар якія-небудзь змены. Гэта можна рабіць кожным зразумелым чынам, але не так, каб наводзіць па думку, што ліцэнзіят падтрымлівае вас або выкарыстанне вамі гэтага твора.
- распаўсюджванне на тых жа ўмовах – Калі вы змяняеце, адаптуеце ці ствараеце вытворны твор на аснове гэтага, то павінны распаўсюджваць атрыманы ў выніку твор на ўмовах такой самай ці сумяшчальнай ліцэнзіі, што і арыгінал.
Журнал арыгінальнай загрузкі
- 2008-02-01 07:29 Xiong Chiamiov 1115×647× (23395 bytes) optimized using optipng
- 2005-07-07 18:59 Ctrl build 1115×647× (28801 bytes) An image of Kardashev scale projections ranging from 1900 to 2100. The projections are off by 0.1 on the kardashev scale. This is graphed against the supportable population and given growth against the supposed technology growth associated the the kardash
Гісторыя файла
Націснуць на даце з часам, каб паказаць файл, якім ён тады быў.
| Дата і час | Драбніца | Памеры | Удзельнік | Тлумачэнне | |
|---|---|---|---|---|---|
| актуальн. | 00:13, 28 чэрвеня 2012 | | 1 115 × 647 (23 KB) | OgreBot | (BOT): Reverting to most recent version before archival |
| 00:13, 28 чэрвеня 2012 |  | 1 115 × 647 (28 KB) | OgreBot | (BOT): Uploading old version of file from en.wikipedia; originally uploaded on 2005-07-07 18:59:33 by Ctrl build | |
| 11:03, 18 лютага 2012 |  | 1 115 × 647 (23 KB) | BPK | {{BotMoveToCommons|ru.wikipedia|year={{subst:CURRENTYEAR}}|month={{subst:CURRENTMONTHNAME}}|day={{subst:CURRENTDAY}}}} The upload bot is User:CommonsHelper2 Bot which is called by [http://toolserver.org/~commonshelper2/index.php CommonsHelper2]. The t |
Выкарыстанне файла
Наступная 1 старонка выкарыстоўвае гэты файл:
Глабальнае выкарыстанне файла
Гэты файл выкарыстоўваецца ў наступных вікі:
- Выкарыстанне ў bg.wikipedia.org
- Выкарыстанне ў en.wikipedia.org
- Выкарыстанне ў tr.wikipedia.org