Файл:Milankovitch Variations.png
Milankovitch_Variations.png (479 × 363 кропак, аб’ём файла: 32 KB, тып MIME: image/png)
Тлумачэнне
| Апісанне |
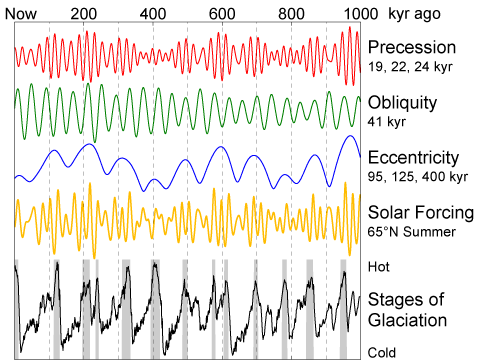
English: This figure shows the variations in Earth's orbit, the resulting changes in solar energy flux at high latitude, and the observed glacial cycles.
According to Milankovitch Theory, the precession of the equinoxes and the apsides, variations in the tilt of the Earth's axis (obliquity) and changes in the eccentricity of the Earth's orbit are responsible for causing the observed 100 kyr cycle in ice ages by varying the amount of sunlight received by the Earth at different times and locations, particularly high northern latitude summer. These changes in the Earth's orbit are the predictable consequence of interactions between the Earth, its moon, and the other planets. The orbital data shown are from Quinn et al. (1991). Principal frequencies for each of the three kinds of variations are labeled. The solar forcing curve (aka "insolation") is derived from July 1st sunlight at 65 °N latitude according to Jonathan Levine's insolation calculator [1]. The glacial data are from Lisiecki and Raymo (2005) and gray bars indicate interglacial periods, defined here as deviations in the 5 kyr average of at least 0.8 standard deviations above the mean. |
| Дата | 11 лютага 2006 (upload date) |
| Крыніца | Уласная праца |
| Аўтар | This image was produced by Robert A. Rohde from publicly available data, and is incorporated into the Global Warming Art project. |
| Іншыя версіі | Derivative works of this file: Variacions de Milankovitch.png |
References
- Lisiecki, L. E., and M. E. Raymo (2005), "A Pliocene-Pleistocene stack of 57 globally distributed benthic δ18O records." Paleoceanography 20, PA1003, doi:10.1029/2004PA001071 (alternative full text link: [2]).
- Quinn, T. R., S. Tremaine, and M. Duncan (1991), "A Three Million Year Integration of the Earth's Orbit." The Astronomical Journal 101, pp. 2287-2305, doi:10.1086/115850.

|
This graph image could be re-created using vector graphics as an SVG file. This has several advantages; see Commons:Media for cleanup for more information. If an SVG form of this image is available, please upload it and afterwards replace this template with
{{vector version available|new image name}}.
It is recommended to name the SVG file “Milankovitch Variations.svg”—then the template Vector version available (or Vva) does not need the new image name parameter. |
Ліцэнзіяванне

|
Дазваляецца капіяваць, распаўсюджваць і(або) мадыфікаваць гэты дакумент на ўмовах ліцэнзіі GNU FDL версіі 1.2 або навейшай, выдадзенай Фондам свабоднага праграмнага забеспячэння; без Нязменных раздзелаў, без тэкстаў Вокладак. Копія ліцэнзіі ёсць у раздзеле GNU Free Documentation License. |
| Гэты файл даступны па ліцэнзіі Creative Commons Пазначэнне аўтарства - На тых самых умовах 3.0 Непартаваная | ||
| ||
| Гэтая картка дададзеная ў якасці часткі абнаўлення ліцэнзіі GFDL. |
Гісторыя файла
Націснуць на даце з часам, каб паказаць файл, якім ён тады быў.
| Дата і час | Драбніца | Памеры | Удзельнік | Тлумачэнне | |
|---|---|---|---|---|---|
| актуальн. | 14:35, 11 лютага 2006 | | 479 × 363 (32 KB) | David Legrand | == Description == This figure shows the variations in Earth's orbit, the resulting changes in solar energy flux at high latitude, and the observed glacial cycles. According to Milankovitch Theory, the precession of the [[ |
Выкарыстанне файла
Наступная 1 старонка выкарыстоўвае гэты файл:
Глабальнае выкарыстанне файла
Гэты файл выкарыстоўваецца ў наступных вікі:
- Выкарыстанне ў af.wikipedia.org
- Выкарыстанне ў ar.wikipedia.org
- Выкарыстанне ў bg.wikipedia.org
- Выкарыстанне ў ca.wikipedia.org
- Выкарыстанне ў da.wikipedia.org
- Выкарыстанне ў de.wikipedia.org
- Выкарыстанне ў de.wikiversity.org
- Выкарыстанне ў el.wikipedia.org
- Выкарыстанне ў en.wikipedia.org
- Выкарыстанне ў es.wikipedia.org
- Выкарыстанне ў fa.wikipedia.org
- Выкарыстанне ў fi.wikipedia.org
- Выкарыстанне ў fr.wikipedia.org
- Выкарыстанне ў fy.wikipedia.org
- Выкарыстанне ў gl.wikipedia.org
- Выкарыстанне ў hu.wikipedia.org
- Выкарыстанне ў hy.wikipedia.org
- Выкарыстанне ў id.wikipedia.org
- Выкарыстанне ў ja.wikipedia.org
- Выкарыстанне ў ko.wikipedia.org
- Выкарыстанне ў nl.wikipedia.org
Паказаць глабальнае выкарыстанне гэтага файла.