Файл:Temp-sunspot-co2.svg

Памер гэтага PNG-прагляду для SVG-файла: 720 × 540 пікселяў. Іншыя разрозненні: 320 × 240 пікселяў | 640 × 480 пікселяў | 1 024 × 768 пікселяў | 1 280 × 960 пікселяў | 2 560 × 1 920 пікселяў.
Арыгінальны файл (файл SVG, намінальна 720 × 540 кропак, аб’ём файла: 98 KB)
Тлумачэнне
| Апісанне |
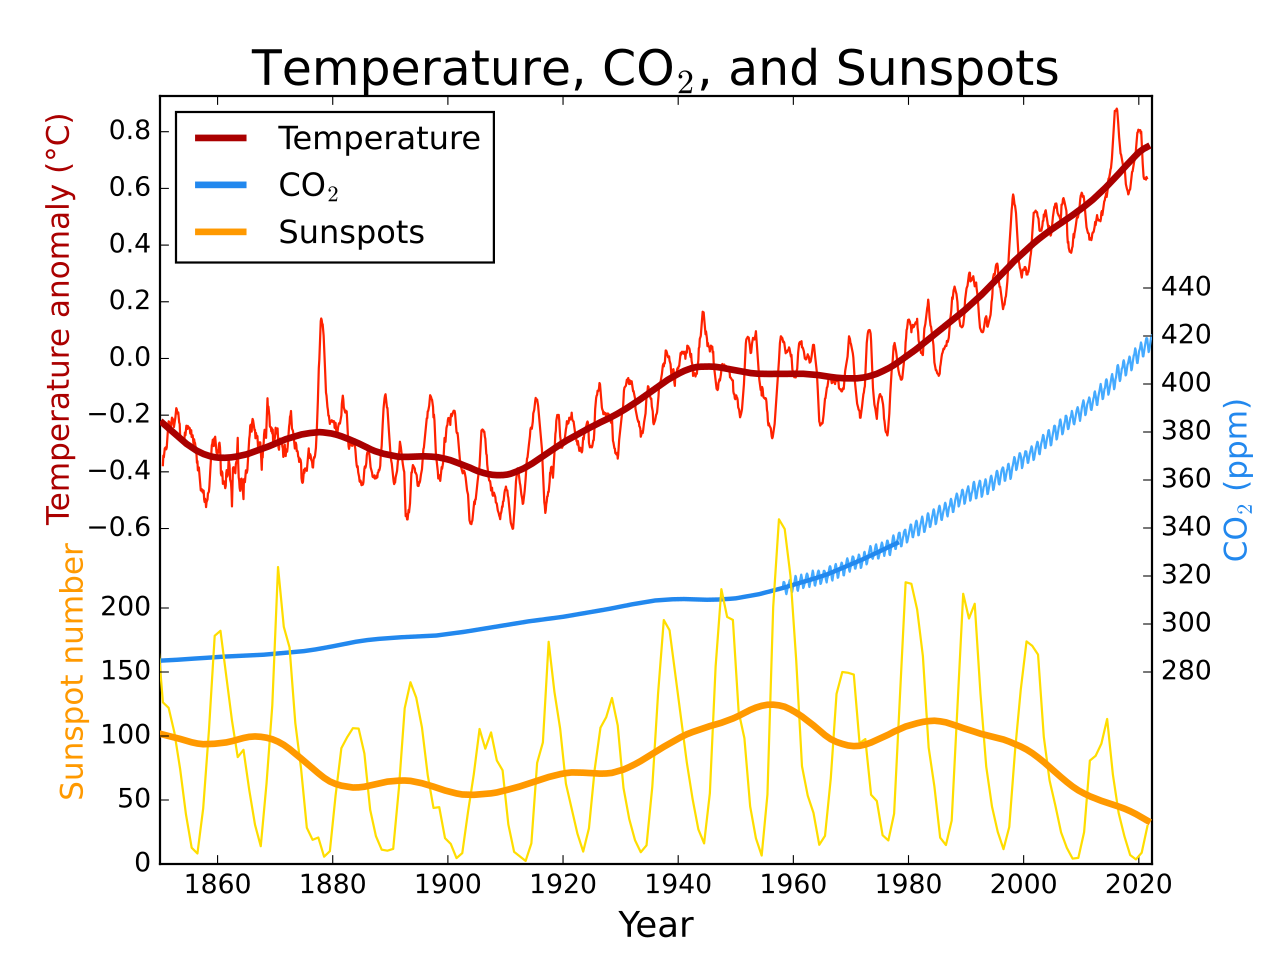
English: Global average temperature, atmospheric CO2, and sunspot activity since 1850. Thick lines for temperature and sunspots represent a 25 year LOWESS and moving average smoothing of the raw data. |
||
| Дата | 11 студзеня 2009 (original upload date) | ||
| Крыніца | Transferred from en.wikipedia to Commons by Anrie using CommonsHelper. | ||
| Аўтар | Leland McInnes at англійская Вікіпедыя | ||
| Іншыя версіі |
|
||
| SVG genesis | Гэты файл (вектарная выява) быў створаны з дапамогай Matplotlib.
Global average temperature, atmospheric CO2, and sunspot activity since 1850. Thick lines for temperature and sunspots represent a 25 year moving average smoothing of the raw data. This figure was produced by Leland McInnes using python and matplotlib and is licensed under the GFDL. All data is from publicly available sources.
| ||
| Крынічны код | Python code#! /usr/bin/env python3
# -*- coding: utf-8 -*-
import numpy as np
import matplotlib.pylab as plt
import matplotlib.ticker as ticker
import urllib3
import ftplib
import shutil
plt.rcdefaults()
plt.style.use('classic')
def saveurl(url, fname):
if url.startswith("ftp"):
ftp = ftplib.FTP('/'.join(url.split('/')[2:3]))
ftp.login('', '')
with open(fname, 'wb') as f:
res = ftp.retrbinary('RETR %s' % '/'.join(url.split('/')[3:]), f.write)
else:
c = urllib3.PoolManager()
with c.request('GET', url, preload_content=False) as resp, open(fname, 'wb') as out_file:
shutil.copyfileobj(resp, out_file)
print('saved', fname, 'from', url)
def smooth_convolution(signal, window_size):
window_size = 1 + 2 * (window_size // 2) # should be odd
w = np.hamming(window_size)
y = (np.convolve(w, signal) / np.convolve(w, np.ones_like(signal)))
return y[(len(w)-1)//2:-(len(w)//2)]
def smooth_lowess(signal, window_size):
s = window_size // 2
window = np.hamming(1+2*s) / np.hamming(1+2*s).sum()
smoothed = np.empty_like(signal)
for i in range(len(signal)):
i0, i1 = max(i-s, 0), min(i+s, len(signal)-1) + 1
# linear LOWESS smoothing
smoothed[i] = np.poly1d(np.polyfit(np.arange(i0, i1), signal[i0:i1], deg=1,
w=np.sqrt(window[i0-i+s:i1-i+s])))(i)
return smoothed
saveurl("http://woodfortrees.org/data/hadcrut4gl/mean:12", "hadcrut4gl.txt")
with open("hadcrut4gl.txt") as temp_file:
temp_years, temps = [], []
for l in temp_file.readlines():
yT = l.split()
if (not l.startswith('#')) and len(yT) == 2:
temp_years.append(float(yT[0]))
temps.append(float(yT[1]))
#print('T', list(zip(temp_years, temps)))
saveurl("ftp://aftp.cmdl.noaa.gov/products/trends/co2/co2_mm_mlo.txt", "co2_mm_mlo.dat")
with open("co2_mm_mlo.dat") as co2_file:
data_rows = [x.split() for x in co2_file if not x.startswith("#") and x.find("-99.99") == -1]
co2_years = [float(x[2]) for x in data_rows]
co2concs = [float(x[3]) for x in data_rows]
#print('co2', list(zip(co2_years, co2concs)))
saveurl("ftp://ftp.ncdc.noaa.gov/pub/data/paleo/icecore/antarctica/law/law_co2.txt", "law_co2.txt")
with open("law_co2.txt", encoding="ISO-8859-1") as lawco2_file:
data_rows = [x.split() for x in lawco2_file if x.startswith(" 1")]
del data_rows[ [float(x[0]) for x in data_rows].index(1010.):]
lawco2_years = [float(x[0]) for x in data_rows]
lawco2concs = [float(x[-1]) for x in data_rows]
#print('lawco2', list(zip(lawco2_years, lawco2concs)))
saveurl("http://www.sidc.be/silso/DATA/SN_y_tot_V2.0.txt", "yearssn.dat")
with open("yearssn.dat") as sunspot_file:
data_rows = [x.split() for x in sunspot_file if "*" not in x]
sun_years = [float(x[0]) for x in data_rows]
sunspots = [float(x[1]) for x in data_rows]
#print('sunspots', list(zip(sun_years, sunspots)))
t_min, t_max = 1850, max(temp_years[-1], co2_years[-1], sun_years[-1])
smoothed_temps = smooth_lowess(temps, 25 * 12)
smoothed_sunspots = smooth_convolution(sunspots, 25)
rect = [0.125, 0.1, 0.775, 0.8]
base_ax = plt.axes(rect)
base_ax.yaxis.tick_left()
plt.yticks([])
plt.xlim(t_min, t_max)
plt.gca().xaxis.set_major_locator(ticker.MultipleLocator(20))
plt.xlabel("Year", size=16)
plt.title(r"Temperature, CO$_2$, and Sunspots", size=22)
temp_ax = plt.axes([rect[0],rect[1]+.42*rect[3],rect[2],.58*rect[3]], frameon=False)
temp_ax.yaxis.tick_left()
plt.plot(temp_years, temps, '#FF2200')
tline = plt.plot(temp_years, smoothed_temps, '#AA0000', lw=3)
plt.xlim(t_min, t_max)
plt.ylim(min(temps)*1.03 - 0.03*max(temps), max(temps)*1.03 - 0.03*min(temps))
plt.yticks(np.arange(-0.6,0.9,0.2))
plt.ylabel(u'Temperature anomaly (°C)', size=14, color='#AA0000')
plt.xticks([])
co2_ax = plt.axes([rect[0],rect[1]+.25*rect[3],rect[2],.5*rect[3]], frameon=False)
co2_ax.yaxis.tick_right()
co2_ax.yaxis.set_label_position("right")
co2_ax.xaxis.tick_bottom()
plt.plot(co2_years, co2concs, '#44AAFF')
cline = plt.plot(lawco2_years, lawco2concs, '#2288EE', lw=2)
plt.xlim(t_min, t_max)
plt.ylabel(r'CO$_2$ (ppm)', size=14, color='#2288EE')
plt.xticks([])
sun_ax = plt.axes([rect[0],rect[1],rect[2],.5*rect[3]], frameon=False)
sun_ax.yaxis.tick_left()
plt.plot(sun_years, sunspots, "#FFDD00")
sline = plt.plot(sun_years, smoothed_sunspots, "#FF9900", lw=3)
plt.xlim(t_min, t_max)
plt.yticks(np.arange(0,250,50))
plt.ylabel("Sunspot number", size=14, color='#FF9900')
plt.xticks([])
plt.sca(base_ax)
t_proxy = plt.Line2D([0], [0], c='#AA0000', lw=3)
c_proxy = plt.Line2D([0], [0], c='#2288EE', lw=3)
s_proxy = plt.Line2D([0], [0], c='#FF9900', lw=3)
plt.legend((t_proxy, c_proxy, s_proxy), ("Temperature", r"CO$_2$", "Sunspots"), loc="upper left")
plt.savefig("Temp-co2-sunspot.svg")
plt.show()
|


Related Images


Ліцэнзіяванне
Leland McInnes from en.wikipedia.org, уладальнік аўтарскіх правоў на гэты твор, добраахвотна публікуе яе на ўмовах наступнай ліцэнзіі:
| Гэты файл даступны па ліцэнзіі Creative Commons Пазначэнне аўтарства - На тых самых умовах 3.0 Непартаваная Subject to disclaimers. | ||
| Пазначэнне аўтарства: Leland McInnes from en.wikipedia.org | ||
| ||
| Гэтая картка дададзеная ў якасці часткі абнаўлення ліцэнзіі GFDL. |

|
Дазваляецца капіяваць, распаўсюджваць і(або) мадыфікаваць гэты дакумент на ўмовах ліцэнзіі GNU FDL версіі 1.2 або навейшай, выдадзенай Фондам свабоднага праграмнага забеспячэння; без Нязменных раздзелаў, без тэкстаў Вокладак. Копія ліцэнзіі ёсць у раздзеле GNU Free Documentation License. Subject to disclaimers. |
Журнал арыгінальнай загрузкі
The original description page was here. All following user names refer to en.wikipedia.
- 2009-01-11 03:45 Leland McInnes 720×540× (102750 bytes)
- 2008-10-09 00:57 Leland McInnes 600×480× (34962 bytes)
- 2007-03-11 02:47 Leland McInnes 600×480× (48910 bytes) Fix for wrong data selection
- 2007-03-11 02:10 Leland McInnes 600×480× (48672 bytes) Update to Had CRUT3 instead of CRUTEM
- 2007-03-10 20:46 Leland McInnes 600×480× (48525 bytes)
- 2007-03-10 20:41 Leland McInnes 600×480× (47761 bytes)
- 2007-03-10 05:01 Leland McInnes 600×480× (33704 bytes) Global average temperature, Mauna Loa CO<sub>2</sub>, and sunspot activity for the last 50 years.
Гісторыя файла
Націснуць на даце з часам, каб паказаць файл, якім ён тады быў.
| Дата і час | Драбніца | Памеры | Удзельнік | Тлумачэнне | |
|---|---|---|---|---|---|
| актуальн. | 23:23, 30 мая 2022 | | 720 × 540 (98 KB) | Geek3 | update 2022-04 |
| 16:11, 9 красавіка 2021 |  | 720 × 540 (106 KB) | Geek3 | update 2021-04 | |
| 16:04, 26 чэрвеня 2020 |  | 720 × 540 (105 KB) | Geek3 | data update 2020-05, enlarge temperature y-axis | |
| 18:10, 6 сакавіка 2020 |  | 720 × 540 (107 KB) | Geek3 | update with 2020 data | |
| 01:15, 23 чэрвеня 2014 |  | 720 × 540 (76 KB) | Kopiersperre | switch from hadcrut3 to hadcrut4 | |
| 23:27, 11 сакавіка 2014 |  | 720 × 540 (62 KB) | Kopiersperre | update | |
| 00:04, 26 чэрвеня 2012 |  | 731 × 551 (75 KB) | Johnanth | New version pulled from file discussion, based on the newly updated Python script. | |
| 21:38, 20 чэрвеня 2011 |  | 731 × 551 (69 KB) | Killiondude | http://m8y.org/tmp/wikipedia/ Someone was kind enough to use updated stats and redo it. | |
| 15:10, 4 мая 2009 |  | 720 × 540 (100 KB) | File Upload Bot (Magnus Manske) | {{BotMoveToCommons|en.wikipedia|year={{subst:CURRENTYEAR}}|month={{subst:CURRENTMONTHNAME}}|day={{subst:CURRENTDAY}}}} {{Information |Description={{en|__NOTOC__ Global average temperature, atmospheric CO<sub>2</sub>, and sunspot activity since 1850. Thi |
Выкарыстанне файла
Наступная 1 старонка выкарыстоўвае гэты файл:
Глабальнае выкарыстанне файла
Гэты файл выкарыстоўваецца ў наступных вікі:
- Выкарыстанне ў bn.wikipedia.org
- Выкарыстанне ў ca.wikipedia.org
- Выкарыстанне ў de.wikipedia.org
- Выкарыстанне ў en.wikipedia.org
- Выкарыстанне ў en.wikiversity.org
- Выкарыстанне ў es.wikipedia.org
- Выкарыстанне ў fa.wikipedia.org
- Выкарыстанне ў fr.wikipedia.org
- Выкарыстанне ў hu.wikipedia.org
- Выкарыстанне ў ig.wikipedia.org
- Выкарыстанне ў it.wikipedia.org
- Выкарыстанне ў ko.wikipedia.org
- Выкарыстанне ў pt.wikipedia.org
- Выкарыстанне ў ru.wikipedia.org
- Выкарыстанне ў sr.wikipedia.org
- Выкарыстанне ў tr.wikipedia.org
- Выкарыстанне ў uk.wikipedia.org
- Выкарыстанне ў zh.wikipedia.org