Файл:Dewpoint.jpg
Няма версіі з большай раздзяляльнасцю.
Dewpoint.jpg (400 × 400 кропак, аб’ём файла: 28 KB, тып MIME: image/jpeg)
Тлумачэнне
| Апісанне |
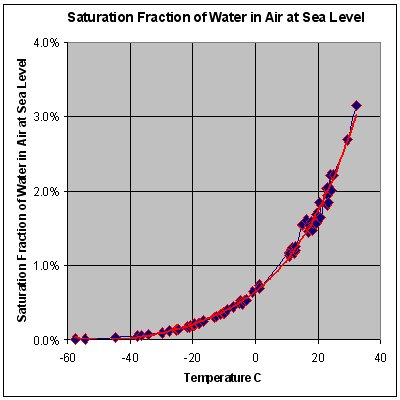
English: Graph of atmospheric dewpoints across a range of temperatures. It was created on August 1, 2004 based on data from the NOAA weather balloon sounding database. |
| Дата | |
| Крыніца | Уласная праца (Transferred from en.wikipedia to Commons by Teratornis using CommonsHelper.) |
| Аўтар | GregBenson at англійская Вікіпедыя |


Ліцэнзіяванне
GregBenson from en.wikipedia.org, уладальнік аўтарскіх правоў на гэты твор, добраахвотна публікуе яе на ўмовах наступнай ліцэнзіі:
| Гэты файл даступны па ліцэнзіі Creative Commons Пазначэнне аўтарства - На тых самых умовах 3.0 Непартаваная Subject to disclaimers. | ||
| Пазначэнне аўтарства: GregBenson from en.wikipedia.org | ||
| ||
| Гэтая картка дададзеная ў якасці часткі абнаўлення ліцэнзіі GFDL. |

|
Дазваляецца капіяваць, распаўсюджваць і(або) мадыфікаваць гэты дакумент на ўмовах ліцэнзіі GNU FDL версіі 1.2 або навейшай, выдадзенай Фондам свабоднага праграмнага забеспячэння; без Нязменных раздзелаў, без тэкстаў Вокладак. Копія ліцэнзіі ёсць у раздзеле GNU Free Documentation License. Subject to disclaimers. |
Журнал арыгінальнай загрузкі
The original description page was here. All following user names refer to en.wikipedia.
- 2004-08-01 16:33 GregBenson 400×400× (28715 bytes) Graph of atmospheric dewpoints across a range of temperatures. I am the author of this figure.
Гісторыя файла
Націснуць на даце з часам, каб паказаць файл, якім ён тады быў.
| Дата і час | Драбніца | Памеры | Удзельнік | Тлумачэнне | |
|---|---|---|---|---|---|
| актуальн. | 10:36, 8 кастрычніка 2009 | | 400 × 400 (28 KB) | File Upload Bot (Magnus Manske) | {{BotMoveToCommons|en.wikipedia|year={{subst:CURRENTYEAR}}|month={{subst:CURRENTMONTHNAME}}|day={{subst:CURRENTDAY}}}} {{Information |Description={{en|Graph of atmospheric dewpoints across a range of temperatures. I am the author of this figure. It was |
Выкарыстанне файла
Наступная 1 старонка выкарыстоўвае гэты файл:
Глабальнае выкарыстанне файла
Гэты файл выкарыстоўваецца ў наступных вікі:
- Выкарыстанне ў ar.wikipedia.org
- Выкарыстанне ў ba.wikipedia.org
- Выкарыстанне ў bn.wikipedia.org
- Выкарыстанне ў ca.wikipedia.org
- Выкарыстанне ў cv.wikipedia.org
- Выкарыстанне ў en.wikipedia.org
- Выкарыстанне ў es.wikipedia.org
- Выкарыстанне ў eu.wikipedia.org
- Выкарыстанне ў fr.wikiversity.org
- Выкарыстанне ў hi.wikipedia.org
- Выкарыстанне ў hr.wikipedia.org
- Выкарыстанне ў kk.wikipedia.org
- Выкарыстанне ў mk.wikipedia.org
- Выкарыстанне ў pt.wikipedia.org
- Выкарыстанне ў ru.wikipedia.org
- Выкарыстанне ў sc.wikipedia.org
- Выкарыстанне ў sh.wikipedia.org
- Выкарыстанне ў sq.wikipedia.org
- Выкарыстанне ў sr.wikipedia.org
- Выкарыстанне ў tt.wikipedia.org